Based on the forecasts in the previous overview, the corrective strengthening of the price below the local resistance level at $14,400 was accompanied by a subsequent reversal
Quotes currently continue the moderate fall. However, as the price approaches the support at $13,600, the likelihood of a volatility expansion and a retest of the swing low at $13,200 increases.
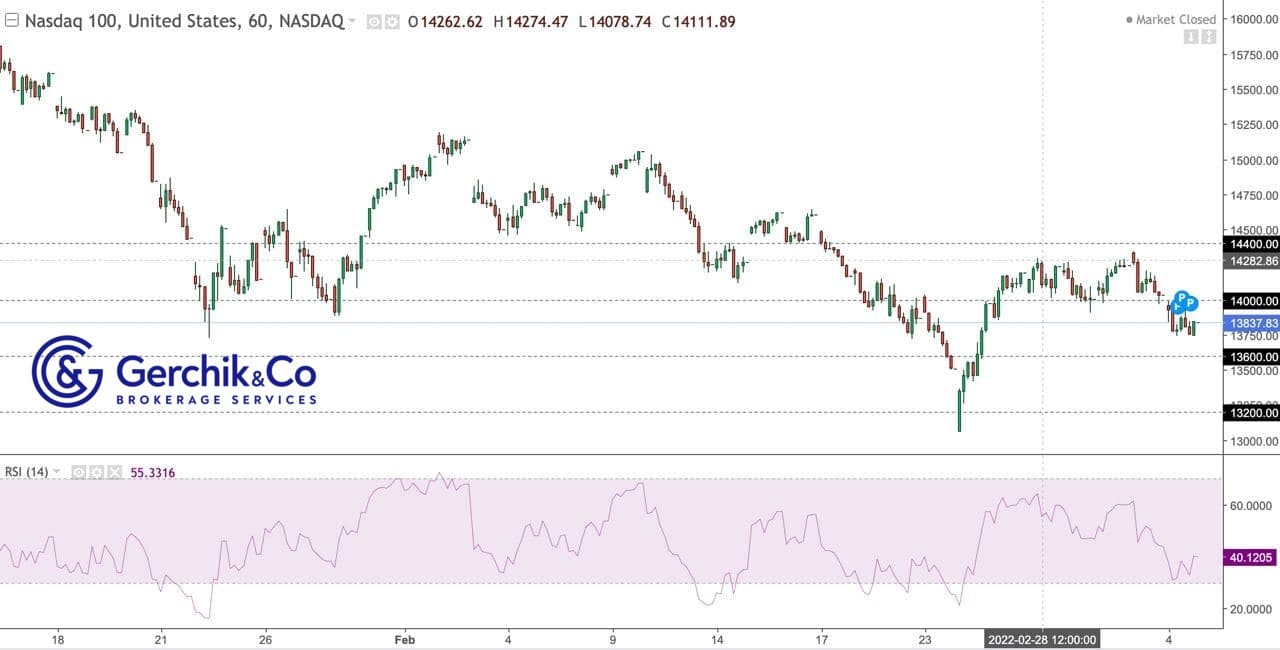
On the intraday chart of the hourly timeframe, we are witnessing the price consolidation above the support at $13,600, which indicates likely speculative retets of this mark in the future.
That being said, the formation of a short-term conversion between swing lows and the RSI oscillator line points to the possibility of a temporary strengthening.
But we can't count on a long-term strengthening until the price strengthens above $14,000 and there is a retest of this mark from above or its impulsive retest with the subsequent closing of the day below it.
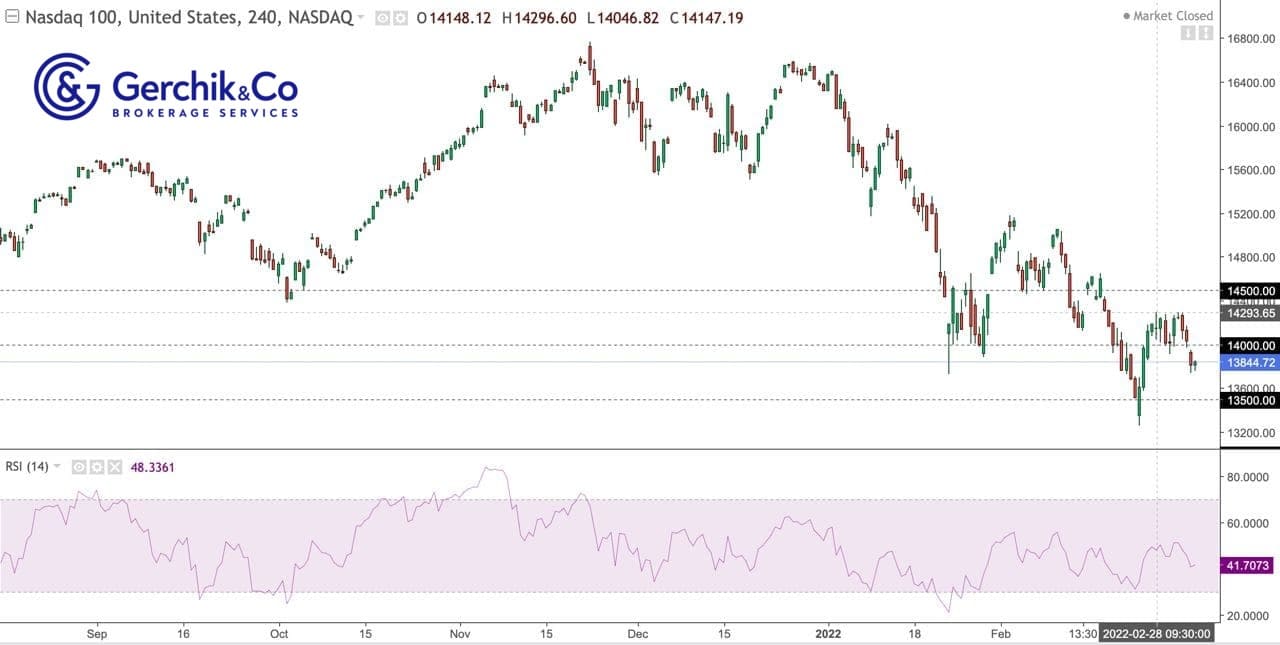
On the 4-hour timeframe, we are seeing an impulsive decline below $14,000, which may continue during the next trading sessions.
Accordingly, we may observe the continuation of the downward movement or a speculative retest of the swing low at $13,200 until the price strengthens above the $14,000 mark.
This scenario remains relevant until the closing of the day above $14,000.