Gann levels are the indicators used to do a technical analysis of financial markets. It was created based on works of William Gann, a legendary finance trader of the twentieth century. It is believed that he had outstanding - even supernatural - abilities to predict price movements and stock exchange events. Using Gann techniques, you can make money in forex with the help of special indicators designed for the Metatrader4 trading terminal.
1. Gann levels in layman’s terms
2. What Gann levels should traders use
3. Gann Line
4. How to use the Gann Fan
5. Gann Grid
6. Does it make sense to use Gann levels
Trading Forex with the use of Gann levels is not an easy thing to do, especially if you are a newbie. In this article, we are going to try and explain it in plain English. And on that note, you can download the Gann indicator or use the ones that are available in the MetaTrader 4 panel.
It is worth mentioning that a lot of legends have always surrounded William Gann’s name. He was born in 1878 in Texas, United States, in a poor family, which is why he had to work since his teenage years. While selling newspapers on trains, William heard people talk about cotton price fluctuations at the commodity exchange. This is when he started asking himself whether there was a way to accurately predict the price changes. Later, at the age of 25, he landed the job at a brokerage firm.
Gann is believed to be a phenomenal trader. During his lifetime, it was claimed that he would rely on scientific literature, numbers, and astrology when making his calculations. To figure out how market cycles work, Gann did actually study ancient geometry, astrology, and mathematics.
There is evidence that Gann predicted the abdication of Kaiser Wilhelm II in November 1918. He is also credited with forecasting the exact level of cotton prices in September 1927, the closure of the stock exchange due to the panic in 1931, the market reaching its bottom on October 5, 1931, as well making a spot-on forecast of the price corridor for the market for the same year.
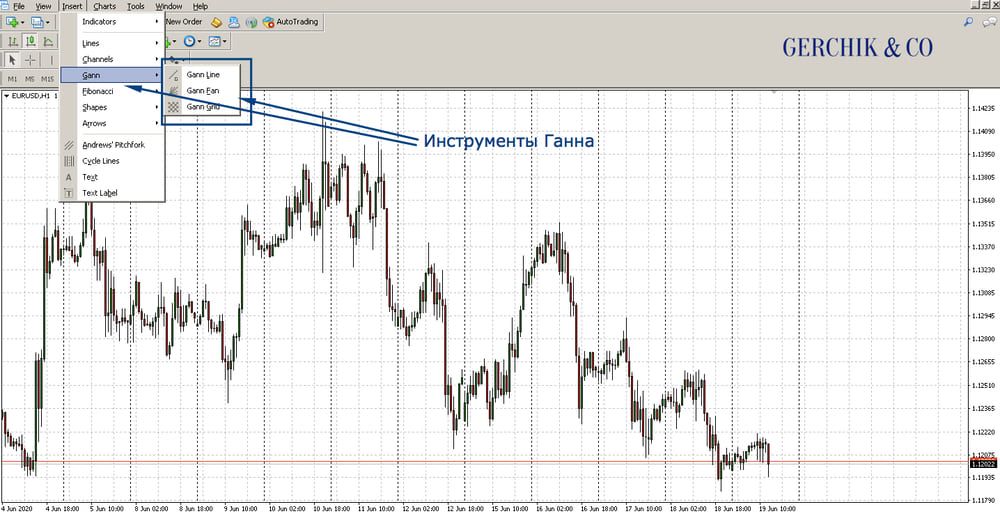
As previously mentioned, the Gann level indicator is included in the standard MetaTrader 4 panel. Traders can use the Gann Line, Gann Fan, and Gann Grid which automatically draw the necessary levels on the chart. Let’s explore each of them one by one.
.jpeg)
The Gann Line is also called “one to one” (1x1). According to Gann himself, it represents the level (line) of the trend. It is stretched on the chart between two points, allowing to determine whether there is currently an upward or downward trend in the market.
This Gann Line indicator is drawn at a 45-degree angle, demonstrating the price change in relation to a certain time period. If the chart is above this line, there is an uptrend in the market. By the same token, if the price is below the Gann line, a downtrend is dominating the market. If the lines intersect, it means that the direction of the key trend is changing.
.jpeg)
Become a client at Gerchik & Co
The second Gann indicator is the Gann Fan. These are inclined lines that are built from one point at different angles. The base (starting) point of the fan must be located at a strong high or low point on the chart. Notably, the fan line which is at a 45-degree angle (i.e. the “one to one” trend line) is the major level and trend direction.
In a similar manner to the previous indicator, the location of the price under the trend line points to a bearish direction in the market. If the price is above it, it is deemed to be a strong support line. If it is broken out, it means that the market is reversing.
The major points and the strong levels of the Gann fan accordingly are angles of 82.5, 75.0, 71.25, 63.75, 45, 26.25, 18.75, 15.0, and 7.5 degrees. It is essential for the fan levels to be drawn correctly on the chart. The easiest way to check their accuracy is to make sure that the one to one line is located strictly at a 45-degree angle.
The traders need to consider the Gann levels in this indicator as inclined lines of support and resistance. The rule that applies here is that the price moves from one strong level to another.
.jpeg)
Gann Grid is another indicator. By the way, you can download Gann indicators, including this one online, if it is not available in your trading terminal. Gann Grid represents a set of trend lines, each of which is inclined at 45 degrees.
If the price on the chart is above the ascending Gann level in the grid, this means there is an uptrend in the market, while the indicator ray itself serves as support. If the quotes are located under the descending ray of the Gann grid, this is a sign of a downward direction, and the line itself can be used as a resistance level.
It must be noted that a trend reversal may develop at the points where the lines intersect in the grid. You need to factor this in when opening trades and taking a profit.
.jpeg)
Aside from three standard indicators discussed earlier, there are others. Typically, you can download Gann indicator from web resources designed for traders for free.
That being said, it is up to you to decide whether or not to use these indicators to make money. When making a choice, make sure to consider the benefits and drawbacks of these tools.
Don’t forget that any tool must first be tested out. Examine its statistics carefully. What might work great for your fellow trader may not be the case for you or vice versa - it may demonstrate excellent results.
Make your trading more profitable
with horizontal volume indicator!
Learn more about the Real Market Volume